- Case study · Data
- 6 technologies
Analytics Platform: real-time dashboards and reports
 Elvisupdated 4 min read
An analytics platform with live dashboards, forecasts and custom reports. Revenue data sits in one place, so nobody has to build a report by hand before making a decision.
The challenge
Revenue data was scattered: some in exports, some in spreadsheets, some in managers' heads. To answer a simple question like "how did this week compare to last week," someone had to sit down and pull the numbers together by hand.
A report like that took a long time and was already out of date by the time anyone opened it. Manual consolidation also led to mistakes, so decisions were made on numbers nobody fully trusted. The business needed a system that shows the current picture on its own and lets you build a report for a specific question.
There was another problem: past numbers did little to help look ahead. Monthly totals showed what had already happened, but not where things were heading.
The solution
I built the platform on React and Node.js. Data is stored in PostgreSQL, and Redis holds a cache so heavy queries don't rerun every time someone opens a dashboard.
I used two charting libraries. Chart.js covers the standard charts people look at every day. D3.js handles cases where off-the-shelf charts aren't enough and the visualization has to be built for a specific task.
Three layers sit on top of the data: real-time dashboards, a custom report builder and forecasting for the main metrics.
The core requirement was simple: the numbers have to match on every screen. That's why all three layers read from one database instead of each pulling from its own export.
How the system works
Real-time business dashboards
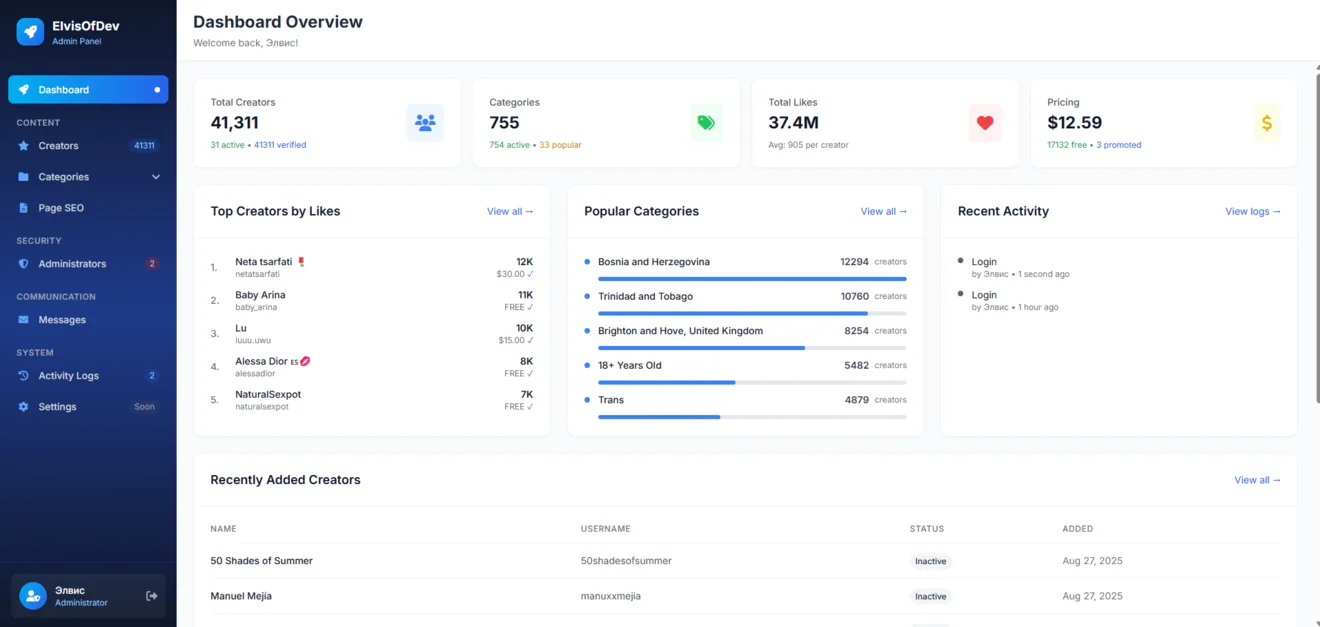
Dashboards update as new data comes in, so the owner sees what's happening now instead of yesterday's export. The main metrics are on one screen, and checking how things are going doesn't mean opening several spreadsheets.
Custom reports for specific questions
Different people in a business ask different questions of the data. So reports in the platform aren't hard-coded. You set them up for the task: the breakdown, the period and the set of metrics you need.
Once a report is set up, it calculates itself from then on. Manual consolidation goes away, and so do the mistakes that always come with it.
Forecasting for revenue and other core metrics
Besides what has already happened, the platform shows a forecast for the main metrics. That makes it easier to see early where a number is heading and to act before the problem shows up in the monthly totals.
Data visualization with D3.js and Chart.js
Familiar charts (lines, bars, shares) are built with Chart.js: they render fast and are easy to read at a glance. For non-standard views of the data I added D3.js, which lets you build a visualization around the task instead of forcing the task into a ready-made template.
Revenue and team analytics in one place
The platform pulls data that used to live in different places into one database. The owner and managers look at the same numbers, and arguments about whose spreadsheet is right stop.
Dashboards, reports and forecasts are all built from one source. When a number changes, it changes everywhere at once, not in one file out of three.
Features
- Real-time dashboards
- Predictive analytics
- Custom reports
- D3.js visualizations
Results
- Dashboards update in real time
- Reports are set up for the task at hand
- Forecasts for the main metrics
Tech stack
- React
- Node.js
- Chart.js
- D3.js
- PostgreSQL
- Redis
Who it is for
Businesses whose revenue and team data is spread across different places and whose reports are still put together by hand. It also fits anyone who wants forecasts for their main metrics on top of last month's totals.
Project FAQ
Can you connect my own data sources?
Yes. Platforms like this are built around the data of a specific business. First we look at where your numbers live now and in what form, then decide how to bring them into one database. Describe your sources to me on Telegram.
What is the platform built with?
The interface is React, the server is Node.js, data is in PostgreSQL and the cache is in Redis. Charts are built with Chart.js and D3.js.
How long does it take to set up business analytics?
It depends on how many data sources you have, what shape they're in and which reports you need at launch. Message me on Telegram and I'll estimate the scope after a short review.
Can I start small?
Yes. Usually people start with one dashboard for the main metrics and add reports and forecasts later, once it's clear which questions come up most often.
Ready to automate your business?
A 30-minute call: we go through your processes, pick what to automate first and estimate the timeline.
- CRM
- Traffic
- Bots
- AI
- Analytics
- Integrations
- Websites
Need something similar
- Data · 2M+ records/dayParseHubA platform that collects data from websites that have no API. Rate limits adjust to each source, data arrives in one format, and you can watch the work in a real-time monitor.

- Data · built-in analyticsLink Bio + AnalyticsA link-in-bio page for a model with links, tips and built-in analytics. The fan comes in and tips right on the page, while the model sees revenue and traffic sources in her own admin panel.

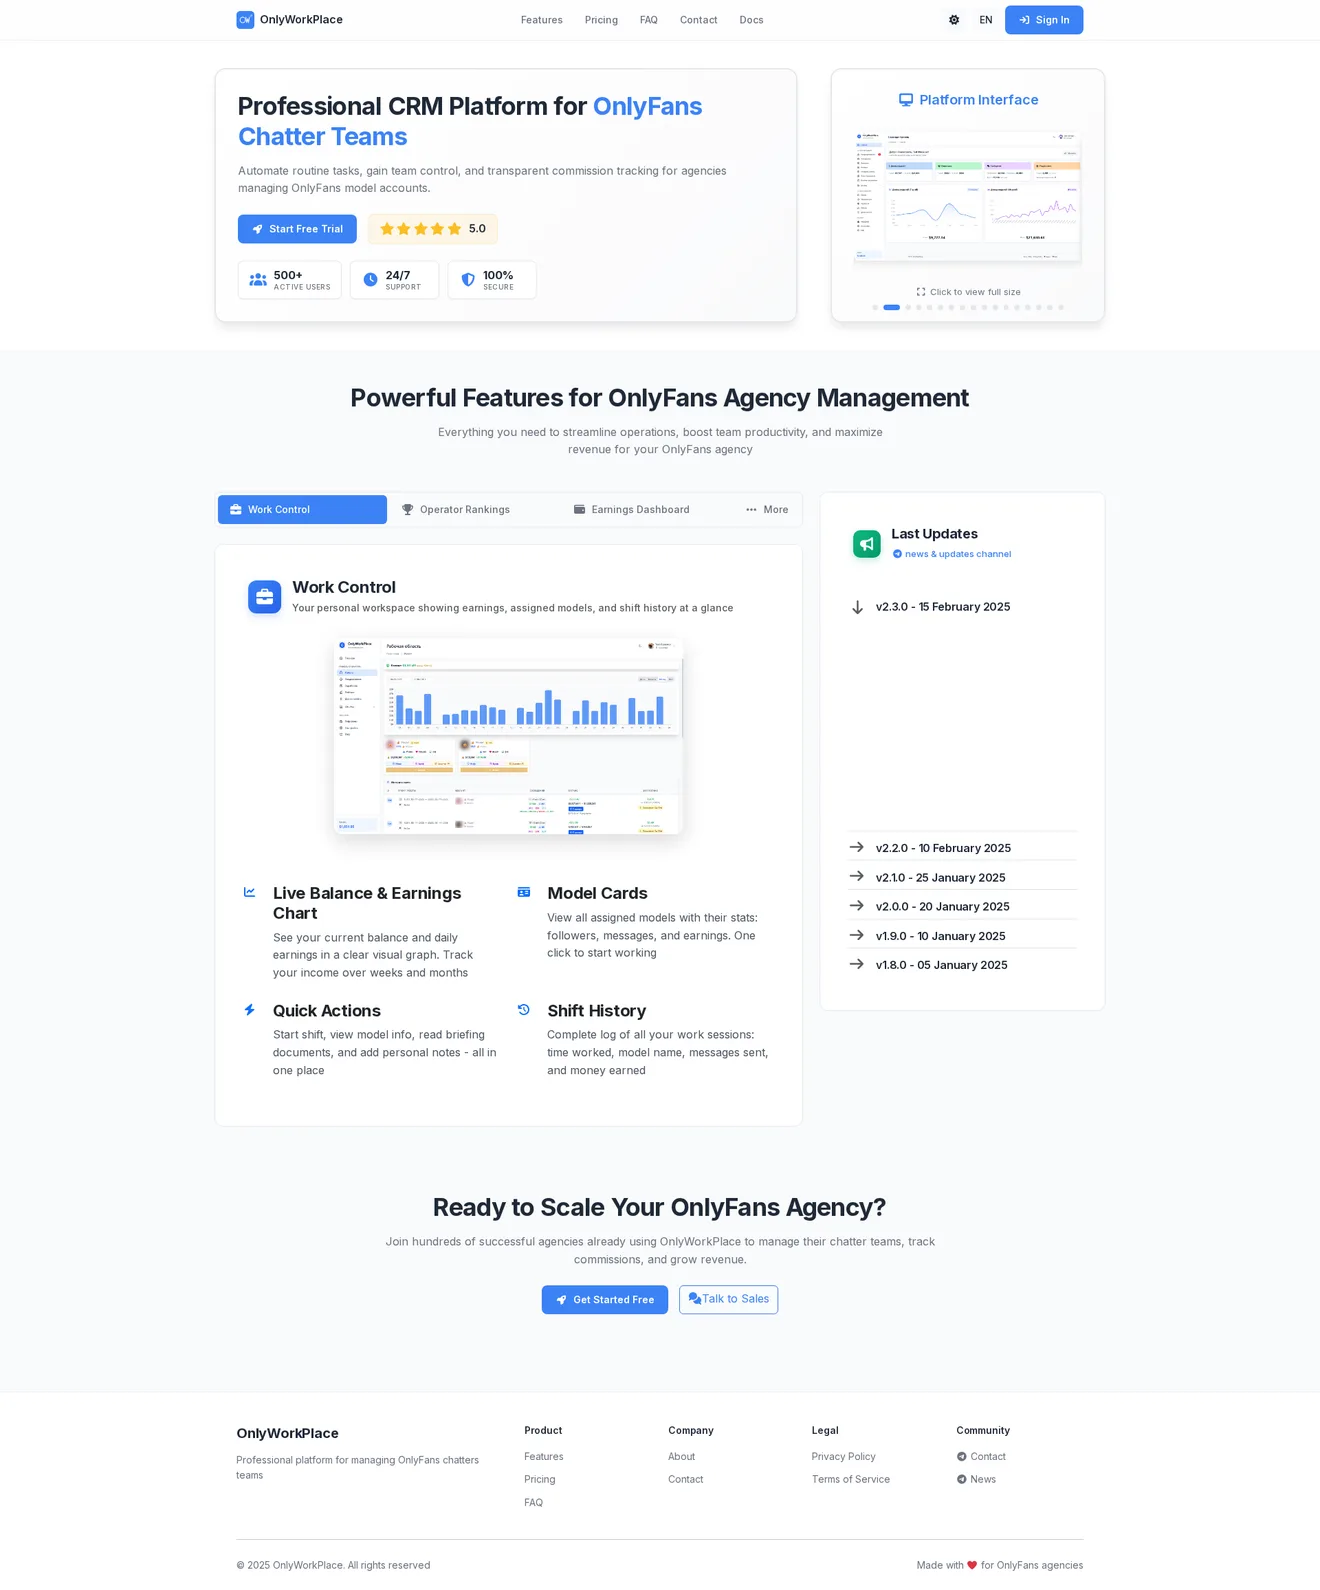
- CRM · 29+ modelsOnlyWorkPlaceA CRM for an OnlyFans agency with a team of chatters working in shifts. Chatters see their shift and earnings, managers watch every shift as it happens, and the owner sees revenue by model and ad ROI on one screen.